The Real Reason: Harmonics Don’t Heat a Transformer Evenly
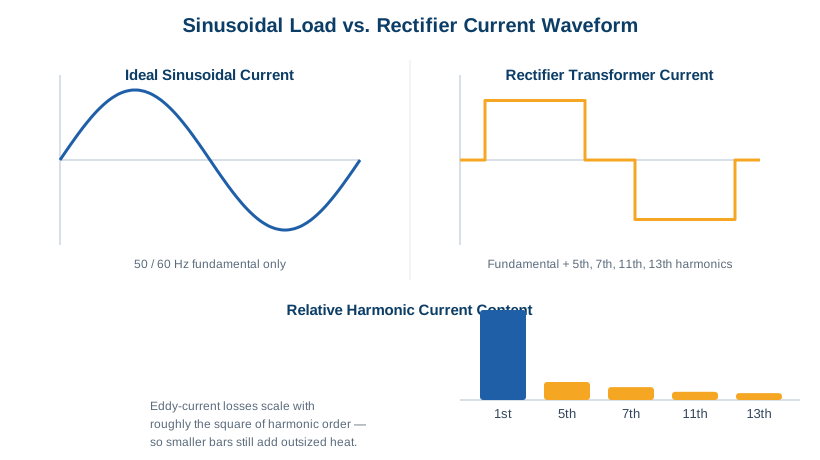
Every rectifier draws current in harmonics i.e. multiples of the base frequency layered on top of the 50/60 Hz fundamental. A six-pulse rectifier, for instance, pulls current rich in 5th, 7th, 11th, and 13th harmonics.
Here’s the part that catches engineers off guard: losses from harmonic currents don’t scale the same way as losses from the fundamental current. Eddy current losses in the windings rise roughly with the square of the harmonic order. A harmonic causes closer to 25 times the eddy-current-loss component per ampere. Stack several harmonics together, and the extra heat adds up fast, concentrated in specific regions of the winding rather than spread evenly.
A technical term defines how much a transformer must be de-rated when it’s expected to carry a harmonic-rich load. But de-rating on paper only manages the average problem. It doesn’t tell you where, or how badly, a specific unit is running hot on a given day, under a given production load.
The Hotspot You Can’t See From the Top-Oil Gauge
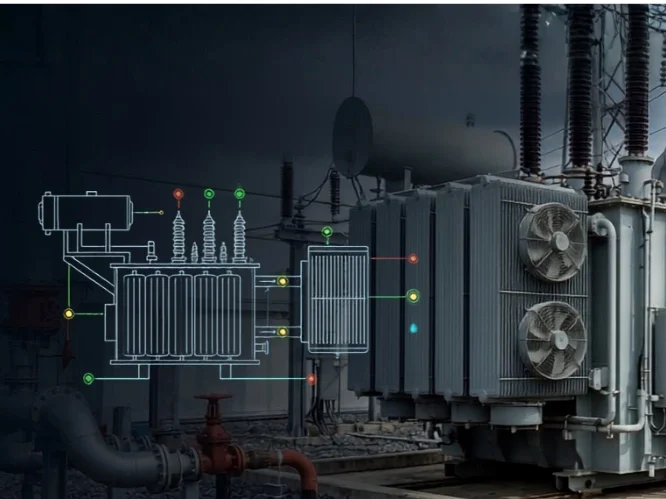
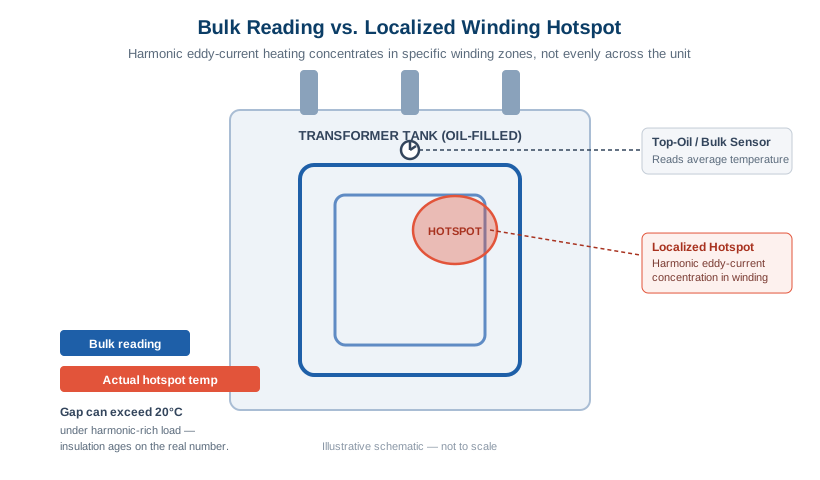
A standard temperature indicator measures top-oil or average winding temperature in a bulk number. Harmonic heating, by contrast, is localized. It shows up as a hotspot in specific winding sections, near clamping structures, or wherever eddy currents concentrate. It may also exceed bulk temperature reading by several degrees and under harmonic loading it can become substantially heigher.
That gap matters because insulation ages on local temperature, not average temperature. A well-known rule of thumb in transformer engineering (the Montsinger rule) holds that insulation life roughly halves for every 6–8°C rise in operating temperature. If the real hotspot is running 20°C above what the gauge shows, the paper insulation at that spot is ageing several times faster than the maintenance team believes.
Left unmanaged, this plays out in a fairly predictable sequence:
- Localized heating builds silently in winding sections carrying the highest harmonic content. Bulk temperature readings still look normal.
- Insulation breakdown begins, releasing early fault gases into the oil, hydrogen and methane are usually the first to show up.
- Efficiency starts slipping. Higher stray and eddy losses mean the unit consumes more input power for the same DC output, often written off as “normal ageing.”
- The gap between rated and actual capability widens, until a load spike or harmonic surge (a bad rectifier firing sequence, an unbalanced load, a mistuned filter) pushes the hotspot past its limit.
Why Periodic Monitoring Struggle to Identify This
Thermal imaging surveys and DGA sampling are usually done on a calendar (quarterly, half-yearly). Harmonic loading, on the other hand, moves with production. A smelter running near full pot-line current pulls a very different harmonic spectrum than the same plant during a partial shutdown. A snapshot test taken during a quiet period can look perfectly healthy while missing the exact conditions under which the hotspot is at its worst.
Closing the Gap: Watching Load and Harmonics Together
The fix is not a better temperature monitoring instead, it is correlation. Hotspot temperature, real winding current, harmonic content, and dissolved-gas trends all need to be monitored together, continuously, against the transformer’s own load profile.
When an AI-driven monitoring platform tracks these altogether. A hotspot that’s building because of a harmonic-heavy production run looks distinctly different from one developed because of ordinary overload. The gas signature and hotspot estimate confirm the difference, well before a scheduled inspection would.
A rectifier transformer’s nameplate rating describes how it behaves under clean, sinusoidal load. Its actual working life is decided by how it behaves under the load it really carries (spiky, harmonic-rich, and rarely constant). Plants that track hotspot behaviour against real harmonic and load data, rather than relying on periodic bulk-temperature checks, catch the ageing curve while it’s still manageable.
Technical Savings
- Potential Downtime Savings
- Potential Asset Life Increment
- Potential Efficiency Increment