The Core Problem
An energy meter records active energy consumed, measured in kWh. An electricity bill, particularly for HT and LT industrial and commercial connections, is rarely calculated from kWh alone. It typically factors in four additional components:
- Maximum demand, measured in kVA or kW, recorded during a single billing block
- Power factor, applied as a penalty or an incentive across the entire billing cycle
- Contract or sanctioned demand, billed on a minimum-demand basis whether or not that demand is actually drawn
- Time-of-day (ToD) tariff bands, which price the same unit of energy differently depending on when it was consumed
A plant that never breaches its sanctioned load in absolute terms can still be billed heavily if any one of these four mechanisms goes unmanaged. This is why the complaint “my consumption looks normal but my bill is high” is both common and legitimate.
Maximum Demand Excursion
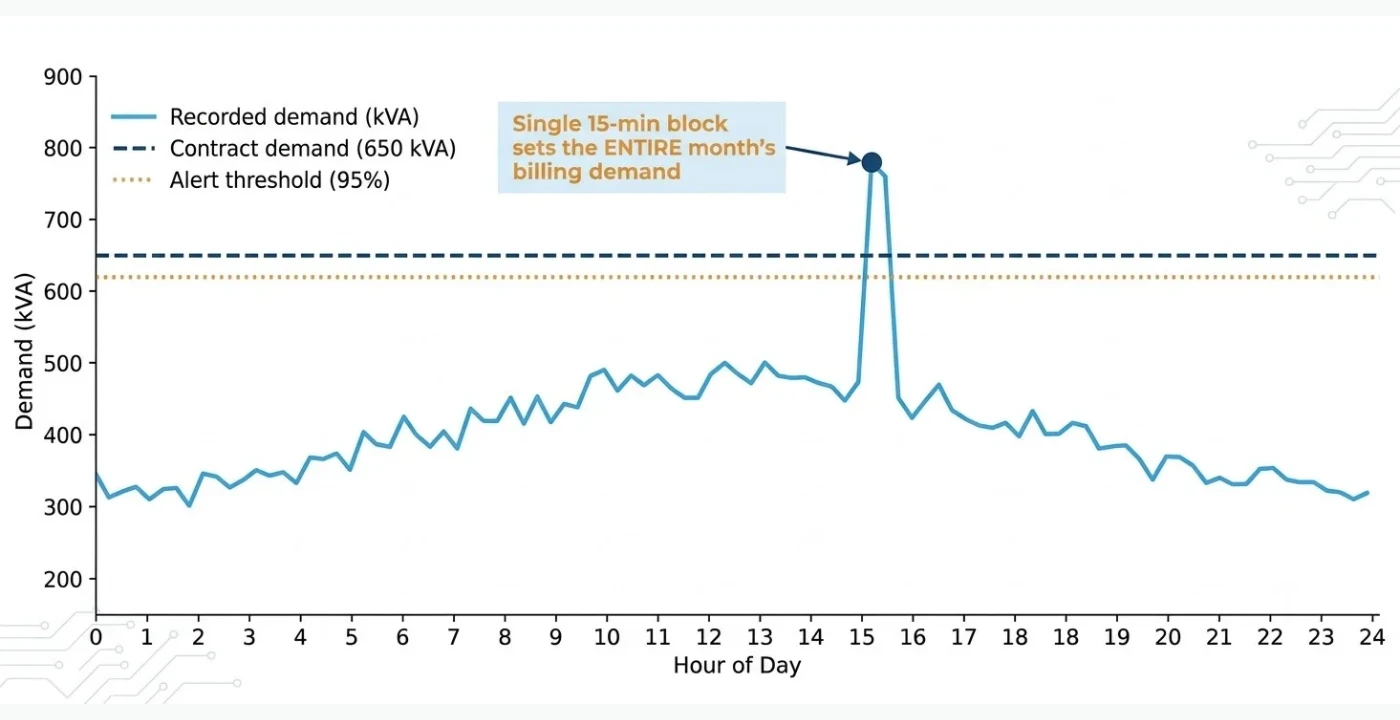
Most Indian DISCOM tariffs calculate demand charges based on the single highest recorded demand block within the billing cycle. This is typically measured as an average over a 15-minute or 30-minute integration period, in line with IEC 61000-4-30 measurement practice.
It is important to understand that this is not an average of the plant’s full load profile. It is a peak snapshot from one short window.
Why This Catches Plants Off Guard
A short-duration event, such as several large motors starting simultaneously, a compressor bank cycling on, or a batch process overlapping with routine operations, can set the billing demand for the entire month, even if the event itself lasts only one integration period.
Once that block has been recorded, it cannot be reversed. There is no mechanism to undo that demand reading after the fact.
Many tariffs apply a penal multiple once recorded demand exceeds the contract demand, which means the overshoot is billed at a rate well above the standard demand rate.
The fix here is procedural as much as it is technical. Visibility is needed during the open billing cycle, not after it closes. A live alert set at around 90 to 95 percent of contract demand, triggered on the same integration period the DISCOM uses, is the only mechanism that can actually prevent a demand excursion. By the time a monthly report shows the number, the block has already been billed and nothing can be done about it.
Power Factor Penalty
Power factor penalties are applied as a percentage adjustment on the cycle average, not on any single reading. This makes them deceptively easy to miss.
A capacitor bank stage that quietly stopped switching two weeks earlier will not trigger an alarm on most legacy panels. It simply shows up later as a worse number on the bill.
Because the penalty is calculated on the average, a plant can operate at a good power factor for twenty-five days and a poor power factor for five days and still take a meaningful financial hit on the invoice.
Most tariffs also include power factor incentive bands. This means a well-managed power factor close to unity is not just avoiding a penalty. It is generating an active saving on the bill.
Checking power factor only at month-end, once the DISCOM bill has arrived, means the corrective window has already closed for that cycle. There is no longer any opportunity to inspect capacitor bank health or verify automatic power factor correction relay settings before the numbers are locked in.
Sanctioned or Contract Demand Set Too High
Most tariffs bill a minimum demand charge, commonly set at 75 percent of the contract demand, regardless of whether that demand is actually drawn. This creates a structural cost that has nothing to do with day-to-day operations.
If a plant’s operational demand has genuinely dropped, because a production line was shut down, a shift was reduced, or equipment was retired, but the sanctioned demand was never revised downward with the DISCOM, the plant continues paying for capacity it no longer uses. This happens every single month.
It is a structural cost rather than an operational one, and it needs a tariff-level correction rather than a shop-floor fix. It is also routinely missed, simply because nobody is comparing actual peak demand trends against the sanctioned figure over a long enough window to notice the gap.
Time-of-Day (ToD) Exposure
The same unit of energy does not cost the same amount at every hour of the day. ToD tariffs price consumption during peak windows at a premium, and this premium can be significantly higher than the off-peak rate. The counter-intuitive part is that the largest consumer of energy on a load profile is rarely the most expensive line item on the bill. Because a smaller load that runs consistently inside a peak-price window can end up costing more than a much larger load that mostly runs off-peak.
Without a parameter-level, time-stamped breakdown of consumption against the applicable ToD bands, this kind of exposure remains completely invisible in a simple monthly kWh total.
How to Actually Close the Gap
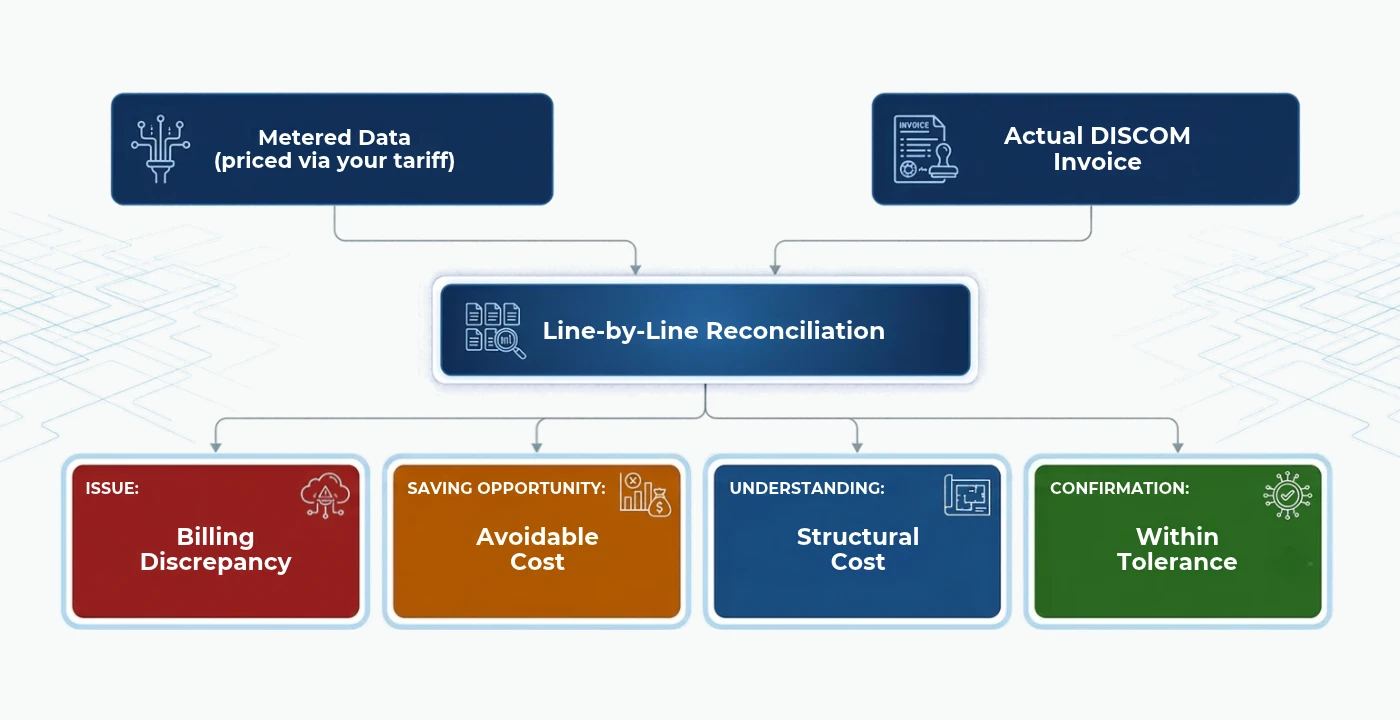
The practical fix is what is often called a shadow bill. This involves taking the plant’s own metered quantities, such as kWh, kVA, and kVARh, and pricing them through the site’s own tariff order, line by line, in exactly the same way the DISCOM would calculate the bill. That computed figure is then compared directly against the actual invoice received.
A proper reconciliation approach sorts every variance into one of four categories:
| Variance Type | What It Means |
| Billing discrepancy | The DISCOM’s invoice doesn’t match what your own tariff-priced calculation says it should be |
| Avoidable cost | A cost driven by an operational issue that can be fixed, such as a demand excursion or a power factor dip |
| Structural cost | A cost built into the contract terms, such as an over-sanctioned demand, that requires a tariff-level correction |
| Within tolerance | A minor variance inside expected metering/rounding tolerance, not worth chasing |
This is exactly the logic built into ESIQ’s Energy Saver Diagnostic Reports. The monthly report performs this shadow-bill reconciliation automatically and attributes every variance to one of these four categories.
The weekly report, meanwhile, tracks the plant’s cycle-to-date position against contract demand and the power factor band while the billing cycle is still open. This is the only window in which a demand excursion can actually be prevented, rather than simply explained after the fact.
Practical Checklist: Diagnosing Your Own Bill Gap
If metered consumption and the electricity bill regularly disagree, work through this sequence before assuming there is a metering error.
- Pull the load profile for the billing cycle at the same integration period the DISCOM uses, usually 15 or 30 minutes, and identify the single highest demand block. This block sets the billing demand for the entire cycle.
- Check the average power factor across the full cycle rather than relying on a single spot reading. A good reading at one moment says nothing about the monthly average the penalty is actually based on.
- Compare actual peak demand trends over the last six to twelve months against the sanctioned or contract demand. If the plant consistently runs well under this figure, a revision request to the DISCOM may be worth pursuing.
- Map consumption against the tariff’s time-of-day bands rather than looking only at total kWh, and identify which specific loads run inside the peak-price windows.
- Price the plant’s own metered data through its tariff order and compare the result to the invoice line by line, rather than comparing only the final total.
Alerts Prevent. Reports Prioritise. The Quarterly Review Verifies.
No report, however detailed, can undo a demand block that has already occurred. Only a live alert, calibrated to the plant’s own asset ratings and contract terms, can intervene while the event is still in progress. Reports then take on the separate job of highlighting attention and quantifying what each item is actually worth in currency terms. A quarterly review closes the loop by verifying what earlier corrective actions actually delivered in savings.
If a team is still reconciling electricity bills by hand every month, or only discovering demand excursions after the invoice has already arrived, a tariff-aware monitoring platform is a more reliable long-term solution than repeated manual audits.
Share your last electricity bill or sanctioned demand details with our energy team at digital@motwane.com for a complimentary review of where your gap is coming from.
Basis: IEC 61000-4-30 (power quality measurement methods), IEC 62053-22 / IS 15959 (static meter accuracy), ISO 50001:2018 Cl. 6.4 to 6.6, 9.1 and 9.3, and IPMVP for verified savings measurement.