Why Total kWh Doesn’t Tell You About Efficiency
Energy consumption moves in line with output. If a plant’s monthly electricity consumption rises by 6 percent, that number means something very different depending on what happened to production during the same period.
If production, measured in tonnage, units, or batches, rose by 8 percent in that period, the plant actually became more efficient. It produced more output while using proportionally less energy per unit produced.
If production fell by 2 percent over the same period, the plant became less efficient. More energy was consumed to produce less output.
A raw kWh figure cannot tell these two very different outcomes apart. This is the core limitation that Specific Energy Consumption is designed to solve.
What is Specific Energy Consumption (SEC)?
Specific Energy Consumption is the amount of energy consumed per unit of production output, measured over the same time window. It is expressed as:
=
Production Output (same window)
Numerator:
Meter Energy to the potential
Denominator:
Tonnes, Unit Of cycles Produced
The production output figure used as the denominator can be almost any unit that suits the process, such as tonnes produced, number of units manufactured, process cycles completed, or output-line volume. What matters most is that the numerator, energy, and the denominator, output, are both measured over exactly the same period. This ensures the resulting ratio reflects a genuine efficiency relationship rather than a coincidence of timing.
A Simple Example
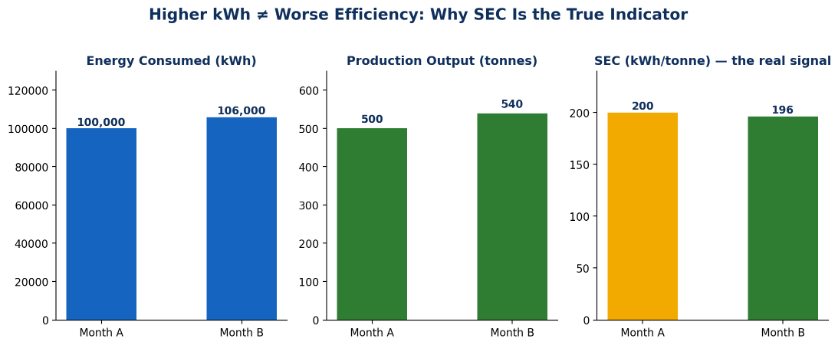
| Month | Energy Consumed (kWh) | Production Output (tonnes) | SEC (kWh/tonne) |
| Month A | 100,000 | 500 | 200 |
| Month B | 106,000 | 540 | ~196 |
Even though Month B consumed more total energy, its SEC is actually lower. This means the plant became marginally more energy-efficient per tonne produced, despite the higher kWh figure. This is exactly the kind of insight that a raw consumption trend hides, and that an SEC trend reveals clearly.
Why SEC Is a Recognised Energy Performance Indicator
SEC, or a close variant of it, is one of the core Energy Performance Indicators referenced under ISO 50001 and ISO 50006, the international standards for energy management systems. These standards specifically require energy data to be normalised against relevant variables, such as production output, weather conditions, or occupancy levels. This requirement exists precisely because comparing raw consumption figures across periods with different operating conditions tends to produce misleading conclusions.
For any facility working toward ISO 50001 certification, or preparing for a management review, SEC, or a site-specific formula derived from it, is typically one of the first indicators an auditor will expect to see trended over time.
Where Production Data Actually Comes From
Calculating SEC looks simple as a formula, but in practice it depends on something many plants underestimate: reliable, timely production data that sits alongside metered energy data. Plants generally capture this in one of three ways.
- Manual entry. Day-wise figures are logged directly against a production log. This is the fastest way to get started and requires no integration effort.
- Excel or CSV upload. An existing MIS or shift-report workbook is mapped to a standard template and uploaded periodically, with validation applied on entry.
- SAP or ERP interface. A scheduled, automated process reads production confirmations directly from the plant’s system of record, so SEC updates without requiring manual intervention.
Whichever method is used, the two data streams, energy and production, need to converge into one shared log. This allows SEC to be calculated consistently, trended over time, and reused across different reports without needing to be recalculated by hand each time.
What SEC Enables
Once SEC is being tracked reliably, it becomes the foundation for several higher value uses across the plant.
- Shift-wise and unit-wise efficiency comparison. This identifies whether one shift or one production unit is systematically less efficient than another, even when total plant output looks perfectly normal.
- Baseline and target-setting. This establishes what a normal SEC looks like for a given process, so that any deviation becomes visible against a defined baseline rather than relying on gut feeling.
- Verified savings measurement. Under frameworks such as IPMVP, the International Performance Measurement and Verification Protocol, SEC-based normalisation is a standard method used to prove that an efficiency improvement is genuine, rather than simply a result of higher output in that particular period.
- Feeding directly into diagnostic reporting. Once SEC has been computed, it can be trended, used as the basis for alerts, and included automatically in any recurring energy report the plant already generates.
A Quick Self-Check
If you are unsure whether your plant is tracking SEC correctly, ask the following questions.
- Are energy and production figures being compared over exactly the same time window, or are they offset, for example by comparing one shift’s energy use against a different shift’s output?
- Is production data captured at a granular enough interval, such as daily or shift-wise, to be genuinely useful, or is it only available monthly, which hides which specific period actually drove a change?
- Is SEC being trended over time, or is it only calculated once as a single snapshot figure?
- Does the SEC calculation account for differences between units or production lines, or is it reduced to a single blended number across a plant that runs genuinely different processes?
The real challenge is the discipline of consistently capturing both sides of it.
The Takeaway
Specific Energy Consumption exists because absolute energy numbers, taken on their own, cannot separate two very different situations: using more energy because the plant did more, and using more energy for the same amount of output.
For any facility that takes energy management seriously, whether the goal is cost control, ISO 50001 alignment, or verified savings reporting, SEC, properly measured against a reliable production log, remains one of the most useful and most underused indicators available.
Want to see how Specific Energy Consumption can be tracked automatically alongside your metered energy data? Write to us at digital@motwane.com and our energy team will walk you through.