Why busbar temperature alone is a misleading indicator?
Busbars are rated conductors. Every busbar has a designed current-carrying capacity (ampacity) and an expected temperature rise above ambient at that rated current. These are typically defined under standards such as IEC 61439 and IEC 60943. A busbar running at 65°C in a 45°C ambient plant room, carrying current close to its rated current, may be operating exactly as designed.
The problem is that a single temperature reading, taken in isolation, cannot tell you whether that heat is genuine or abnormal. Two busbars can show identical surface temperatures for entirely different reasons. The reason may be, one because it is fully loaded, the other because it has a failing joint. Considering both readings the same way is how real faults get unnoticed as “normal operating heat”.
Gradually or suddenly these normal heat gets escalated into unnecessary shutdowns. The only reliable way to tell them apart is to stop looking at temperature in isolation and start looking at temperature relative to load.
Load-Driven Heating of Busbars
According to Joules’s Law, Current flowing through any conductor generates heat and its loss is represented as:
Where,
- P is the power dissipated as heat
- I is the current
- R is the conductor’s resistance.
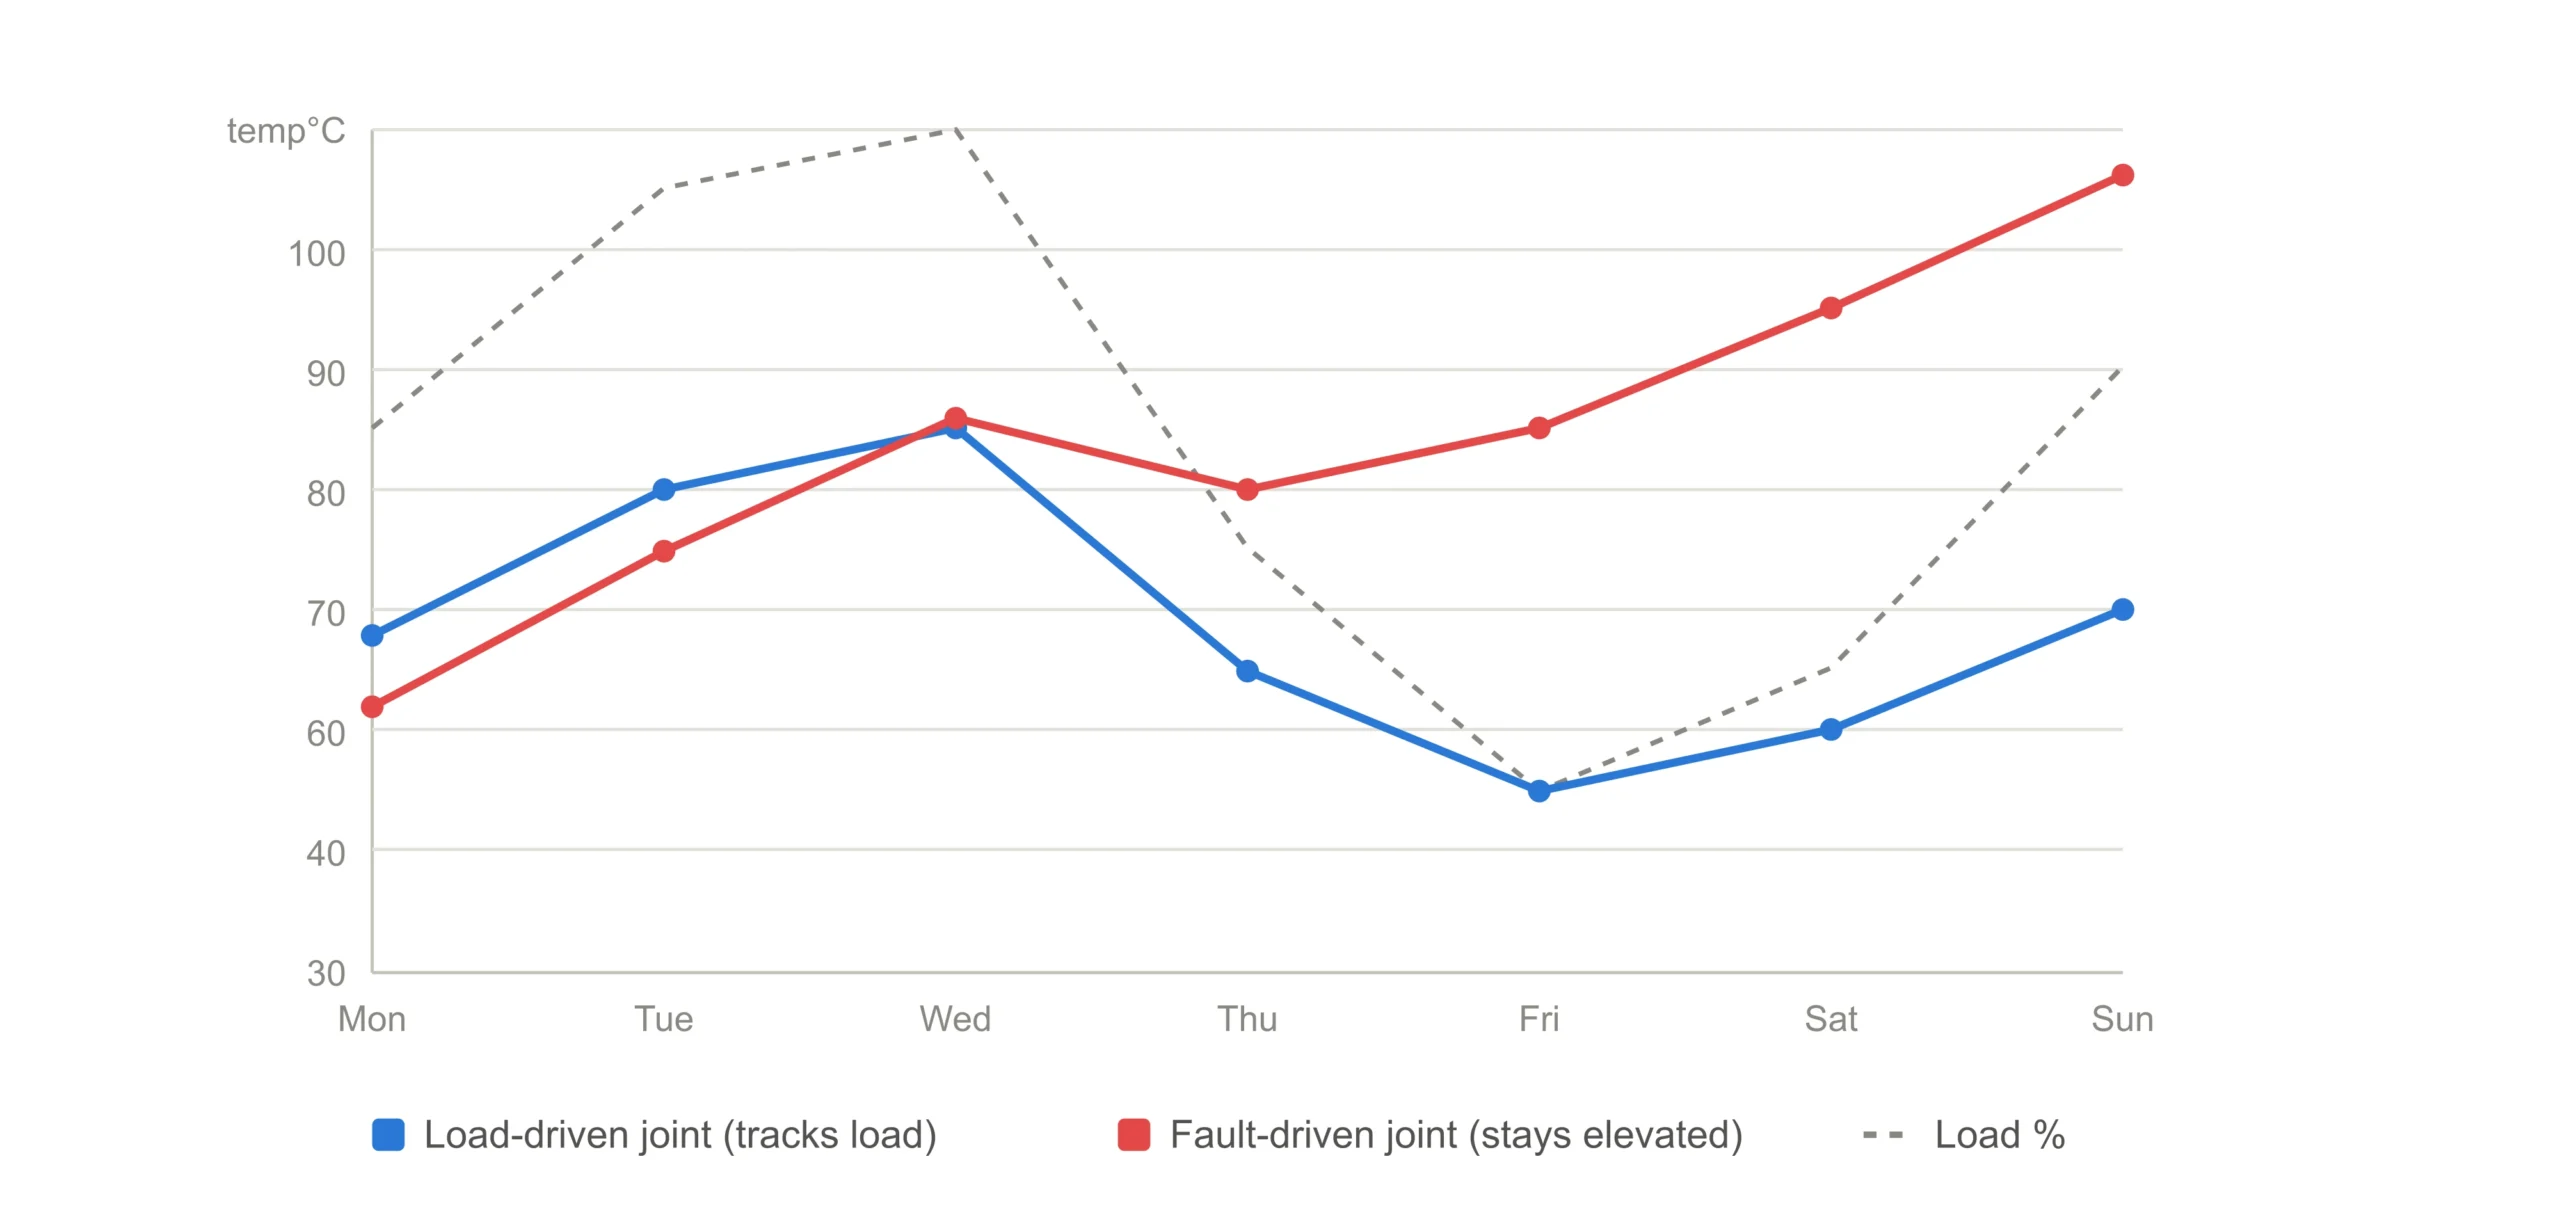
As heat generation scales with the square of current, a busbar carrying 100% of its rated load will run noticeably hotter than one carrying 60% load. This is completely expected and reversible. As load drops, resistive losses drop, and the busbar cools back to ambient temperature within a predictable thermal time constant for a well-ventilated panel.
Key characteristics of load-driven heating:
- It’s Reversible: temperature falls as current falls, following the same I²R relationship in reverse
- Uniform along the conductor: heat is distributed evenly across a good-healthy busbar’s length and is not concentrated at one point
- It’s Predictable: for a given current and ambient temperature, the rise is repeatable and matches the busbar’s rated temperature-rise curve
- Correlates with the full system: if the whole panel is warm during a peak-demand period, that’s consistent with load
Fault-Driven Heating of Busbars
A developing fault changes the scenario entirely, because it doesn’t add heat by raising current. During a fault heat rises due to resistance at a specific point. Loose bolted joints, corrosion, or surface contamination increase local contact resistance.
Since the same I²R relationship applies here, even a small increase in localized resistance produces a large and concentrated rise in temperature. And this change occurs without any change in the current carried by the busbar.
Reason why fault-driven heating looks fundamentally different from load-driven heating:
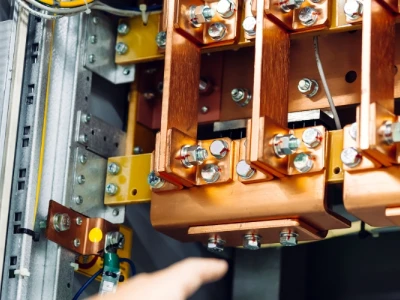
- Localized but not uniform: the hotspot is confined to a joint, terminal, or connection point rather than spread along the conductor
- Non-reversible with load: the temperature stays elevated even after current drops because the underlying resistance defect hasn’t gone away
- Progressive: thermal cycling of repeated heating and cooling accelerates oxidation and loosens the joint further, so the temperature rise at a given load tends to increase over readings, week over week
- Non-uniform from system-wide conditions: one joint runs hot while identical joints nearby, carrying similar current, stay normal
A useful engineering rule of thumb, widely referenced in thermographic inspection standards (such as NETA guidelines), classifies severity by the temperature rise above a comparable component under similar load, rather than by absolute temperature:
| Temperature rise above similar component | Typical classification |
|---|---|
| 1–10°C | Monitor – possible deficiency |
| 11–20°C | Corrective action needed, plan maintenance |
| 21–40°C | Corrective action required as soon as possible |
| Above 40°C | Critical – immediate action |
Note that this table compares rise relative to a healthy reference point, not a fixed absolute number. Hence, load context matters more than the raw temperature figure.
How to separate the two in practice
For a maintenance team without continuous monitoring, this comparison of load vs fault typically means manually logging load percentage alongside thermal scan results and looking for mismatches over time. In application, three checks help separate a real fault from routine load heat:
- Compare against current, not time. Two readings of 75°C taken a week apart mean very different things if the load was 90% in one case and 50% in the other. Always log the load percentage alongside the temperature reading.
- Check for symmetry. In a healthy three-phase busbar system, all three phases carrying similar current should run at similar temperatures. A single phase or joint running consistently hotter than its neighbouring busbar, under equal load, is the early sign of a localized fault.
- Track the trend, not only a snapshot A single thermal image is a data point. A fault reveals itself as a trend. It shows at the same joint, at the same load percentage, running progressively hotter over every week or month.
Manual thermographic surveys can catch this, but manual inspection is limited only at the frequency they’re performed (quarterly or annually). Faults due to loose connections or corrosion can develop and escalate gradually within that inspection interval.
The most trustable solution is the smart health monitoring solution. The Advanced AI-Driven busbar monitoring helps to keep a real-time track on the busbar temperature and gives a complete analysis of its health status.
Why Busbar Monitoring Matters for Maintenance Planning
The general reason to have a proper maintenance is by avoiding the misreading of a load heat as an equipment fault heat. This prevents the unnecessary panel shutdowns and wastes inspection hours in fixing the readings that were never abnormal. Wrong prediction of fault heat as load heat is way costlier.
This means a developing hotspot gets logged as “normal for this time of day” until it progresses to arcing, insulation failure, or a full busbar burn-down. This may lead to a shutdown or a complete asset failure costing a huge loss to the organizations.
The practical solution is continuous correlation between thermal and electrical load data, rather than only depending on the periodic manual comparison. When temperature and load are monitored together over time, the load-driven curve and the fault-driven curve separate on their own. This particular separation shows up early enough to schedule a planned maintenance instead of responding to an unplanned failure.
This is the exact gap that continuous busbar condition monitoring is tailored to. By corelating real-time thermal readings with load data on the same graph. Busbar IQ helps engineering teams see whether a temperature rise is following the load curve or is deviated away. The moment a joint start trending in the wrong direction Busbar IQ alerts the supervision team, well before it reaches a critical threshold.
Explore how Busbar IQ correlates real-time thermal and load data to separate normal operating heat from early-stage faults. Get in touch for a demo.